Follow The Best Trend Strategy For Binary Options Trading (Free Checklist)
Do you know why trend strategy is the most powerful trading strategy for binary options traders?
Let me explain.
Trading isn’t an effortless task. Even though you know how to take a slice from the binary market, still you need to focus more on the trading strategy. Since you’re a new kid on the block, binary trading undoubtedly attracts you because of its exclusive features. Instead of studying several, it’s appropriate to choose the narrow focus strategy.
And now come to the best part.
Trend strategy is one of the most effective and universal concepts that you can apply to the different financial market. The leading benefit is that it allows investors to pinpoint market momentum and to enjoy the favours of that.
But the question is how to identify and follow the trend that increases your winning rate?
That is what we will discuss throughout this following article. The article is a combination of multiple super trend trading strategies, indicators, and winning secrets with the FREE checklist.
What Is Trend Strategy?
Especially in Options Trading, it is required to predict the right asset price movement to get profits. As a trader, you are quite familiar with every aspect of trading. However, one doesn’t need to know everything before walking into the path.
But how to trade options article will definitely give the reasons why traders need to understand strategies. On the other hand, trend strategies are the most successful ones.
In a simple note, the trend is all about a general direction. Traders use technical indicators to find out the right direction of market momentum. By analysing the historical price movement, one can forecast the future particular direction, either up or down.
And notably, we call this trend. Moreover, a specific group like position & swing traders mostly adopt this trading style.
According to Jaymin Shah,
Don’t blindly follow someone, follow market and try to hear what it is telling you.
Note that trend trading strategy usually suitable for mid and long-term traders. However, you can use this methodology in any time-frame.
Is Trend Strategy Important To Adopt?

Have you heard about the KISS rule? It was used as a principle for design by the U.S. Navy in 1960. The rules say that “keep it simple, stupid!”
Not only the trend strategy but also other strategies are eventually important to follow if you don’t want to establish yourself as a gambler. However, the trend strategy has some tremendous benefits.
The most remarkable advantage is that the strategy will improve the win rate. It gives you more voluminous option depends on the time-frame. Furthermore, traders use various indicators to identify the right direction of market momentum.
Apart from these, the analysis will ensure the highest risk to reward ratio. Moreover, you can happily apply trend strategy across any market. That means whether you trade with currencies or coins, trend lines are always there to determine your fate.
Adopting a trend trading strategy, famous traders almost filled their wallet with money. Jesse Livermore, the most famous trader, made $100 million in 1929. Similarly, Richard Dennis made $400 million by trading the futures market.
So, if you want to score the highest, identify and understand trends that perfectly goes with you. Not against you.
Basic Types Of Trend: List To Be Pinned
Identifying the right trend is necessary. Usually, it brings success in trading if ones can grab the market sentiment properly. However, by only following trends, you won’t be able to make money. So remarkably, using other indicators is also essential.
The upward and downward flow of the market will help traders to understand the market volatility by just a glance.
There are three basic types of trends that one should pin. These are:
- UpTrend
- DownTrend
- SidewayTrend
Each type of trend gives you an overall idea of market movements. As we mentioned above, to find out the trend, traders use different indicators along with the trend line.
However, in this phase, we will only bring up the definition of three trends.
What Is UpTrend?
We usually consider an uptrend as a rising trend. It describes when any financial asset’s price is getting higher. Some traders and investors only choose this bull market to trade and earn profits.
When the trend shows an upward curve, it means to call or long of the trade. In one sentence, it allows you to get profits from rising asset’s prices.
Technical traders prefer to use trend lines to identify an uptrend. Traders draw lines on charts and connect a series of prices.
The Basics Of DownTrend
A downtrend is the opposite of an uptrend. When the financial asset’s prices go down, it describes as a downtrend. That means a downtrend is a combination of lower highs and lower lows.
However, it’s similar to the uptrend but the prices mainly moving to an opposite direction. Moreover, the downtrend is a popular choice for stock traders. Traders like to pick the short-selling to receive profits from the bear market.
Definition Of Sideways Trend
The definition of a sideways trend differs completely from both uptrend and downtrend. Here, your down move and up move is extremely restricted. In this certain period, the market moves both upward and downward simultaneously.
Moreover, the financial asset price follows a particular horizontal price direction.
According to the bookish definition, the sideways trend describes when the price moves up and down by remaining at approximately the same level.
Top 5 Popular Trend Indicators - Potion Of Traders
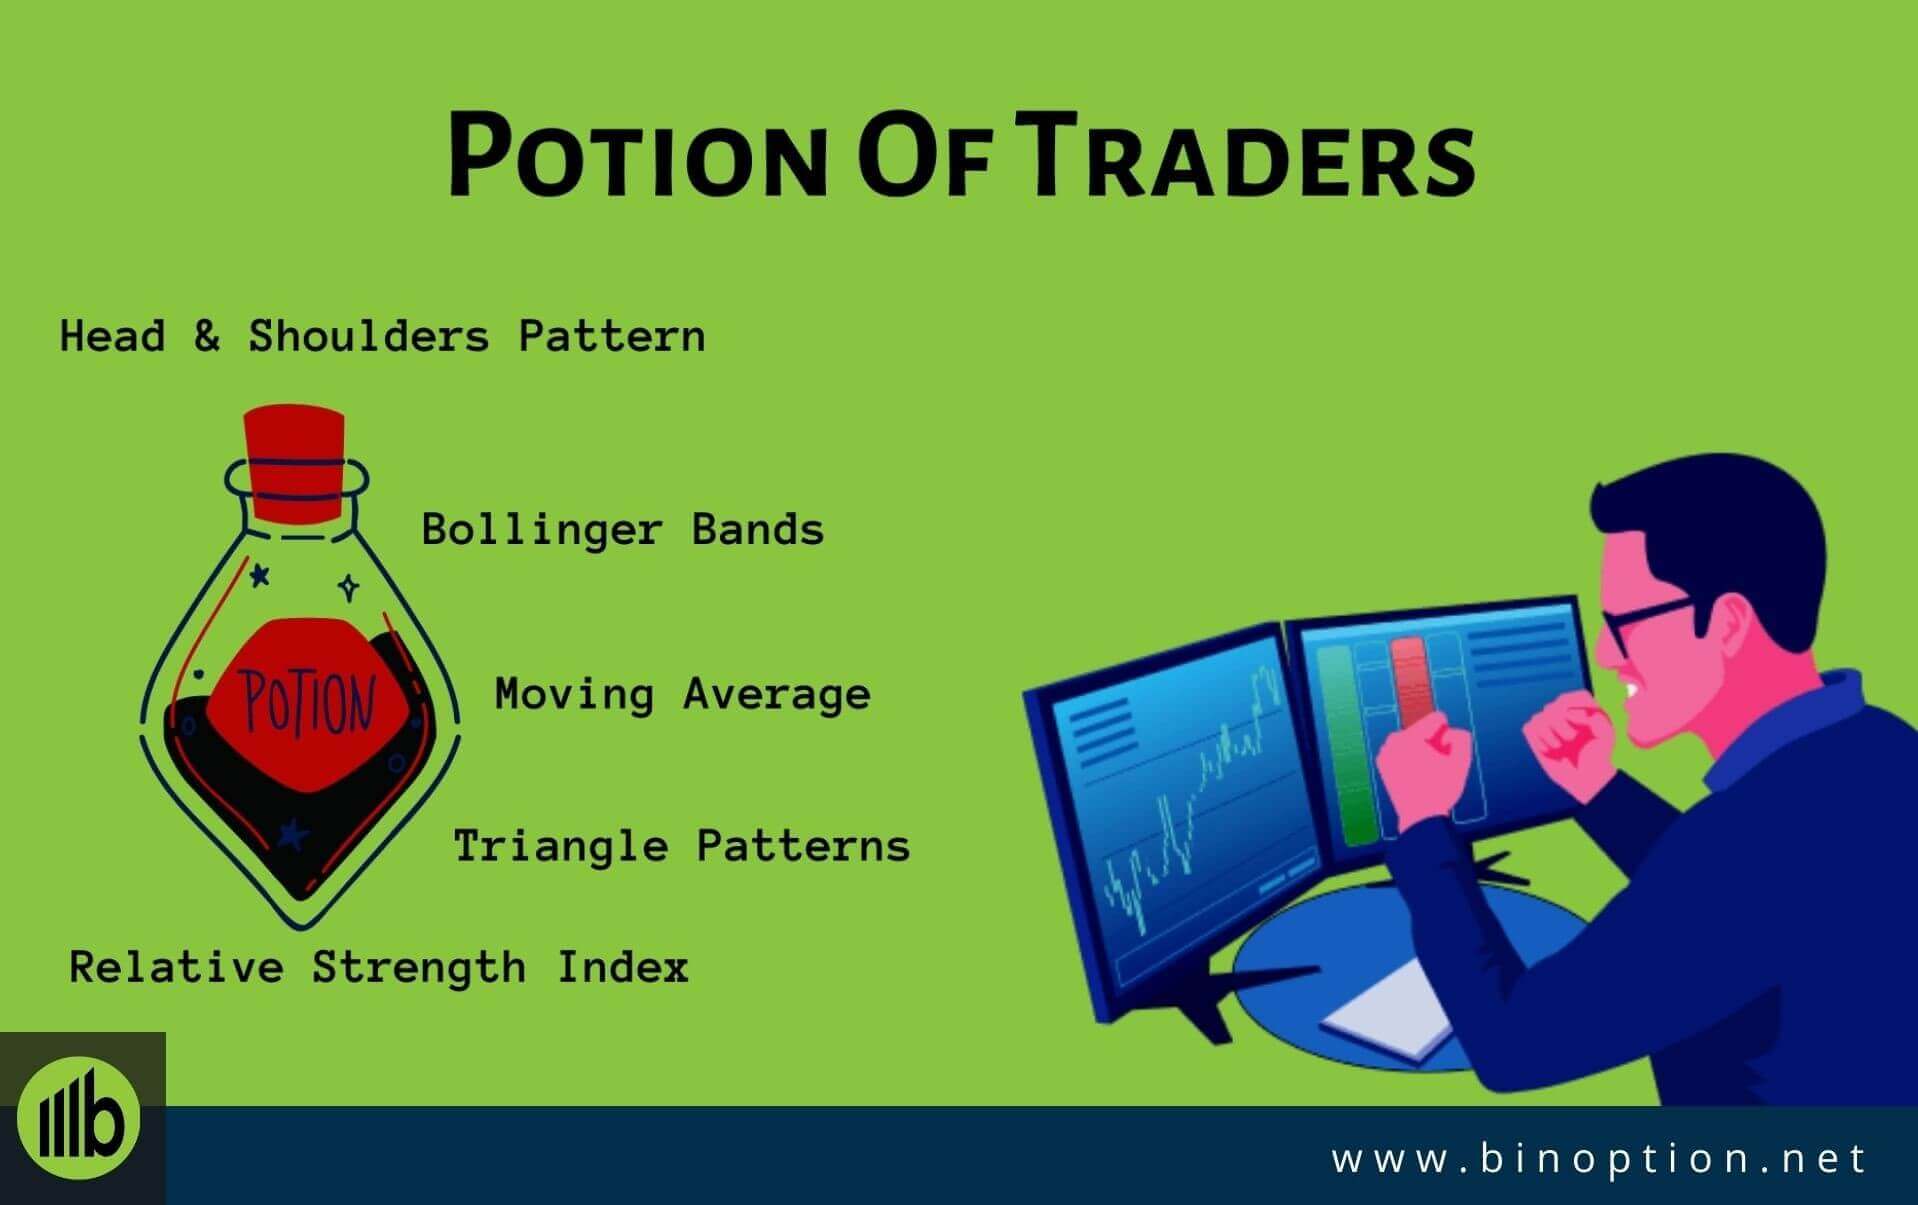
Indicators are marked as a potion to trend traders. Moreover, trading Indicators such as the bars or candlesticks also give you a report on how things work within a couple of minutes of market fluctuation.
Traders use indicators to create a plot from where they can get a rational idea of market behaviour. Of course, you need to form a strategy to win the endgame.
There are hundreds of indicators available. Will you choose all of these to trade market? Obviously, no. You can either pick one or two to analyze the market for the future move.
So, today, we are going to point out the best five trend indicators those widely used by beginners to expert level traders.
The Journey Of Moving Average:
Moving averages are the most common and popular trading indicators. It’s hard to find a single trader who didn’t use Moving Averages in their entire trading life. The moving average can filter out the noise from random price movement and smooth it out to to see the average value.
Traders use this familiar indicator to find out trends and confirm a reversal. However, there are different types of moving averages.
For example, if the price is above the moving average line, traders consider it as an uptrend. On the flip side, if the price is below the moving average line, point it as a downtrend.
So, clearly, the indicator shows the direction of the trend on the actual instrument’s price. Note that it also uses to identify the areas of support and resistance.
Now, you can buy and sell assets using these indicators. Also, note that the MA is based on past prices. It will not warn you. So, it cannot determine if the trend will end or not.
Bollinger Bands - The Popular Tool:
Is it necessary to know who invents this popular technical analysis tool to use on charts? For general knowledge, you can have a small introduction, though the answer is negative.
A famous trader, John Bollinger, developed it. He designed this technical tool to discover opportunities.
Mainly, Bollinger Band is a set of three bands to measure volatility.
According to Investopedia,
A Bollinger Band is a technical analysis tool defined by a set of trend lines plotted by two standard deviations (positively and negatively) away from a simple moving average (SMA).
If the bands are far away from the current market price, then the market is volatile. If they are close to the market price, then the opposite scenario will happen.
Head & Shoulders Pattern - The Master Of Trend Reversal:
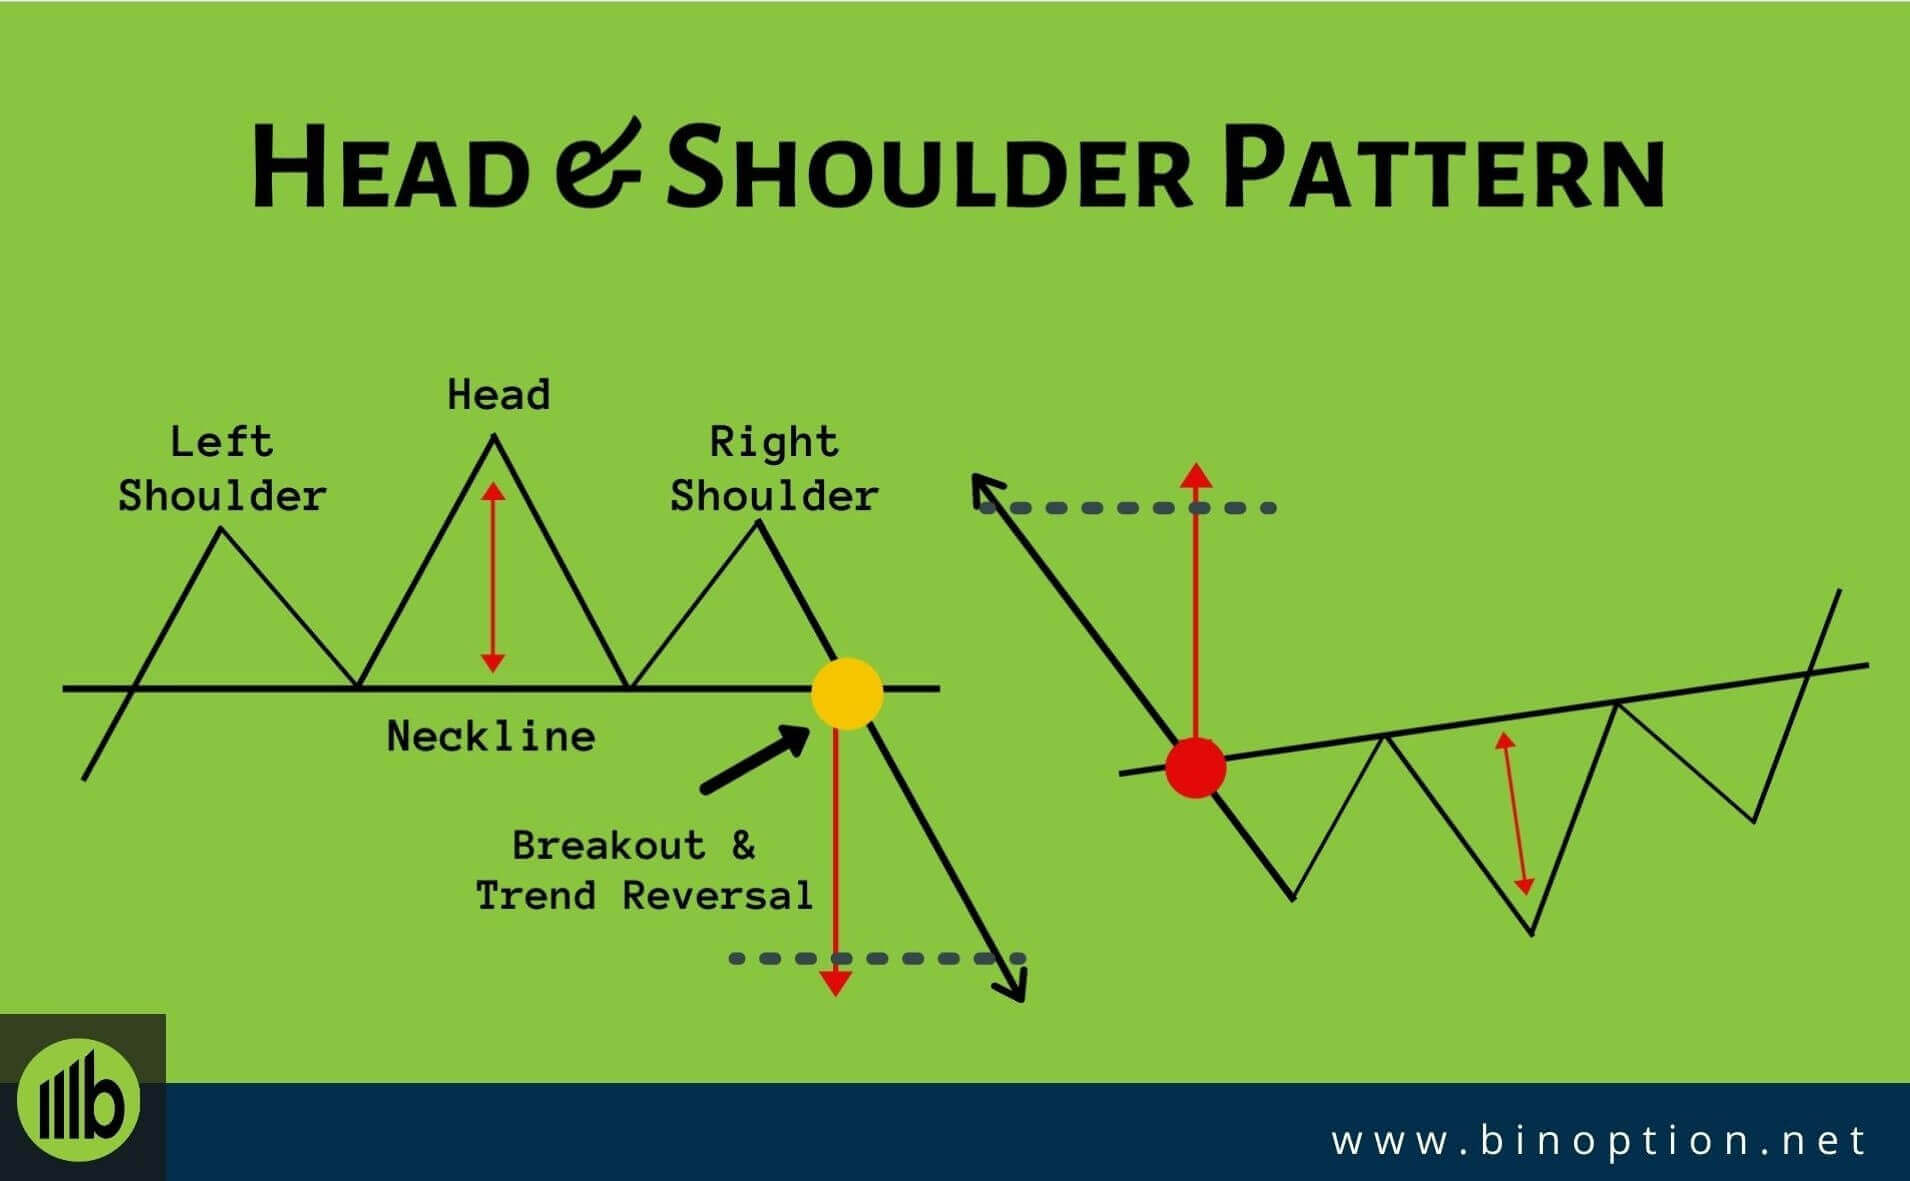
Head & Shoulders pattern is a trend reversal pattern. With the help of three reversal signals, traders identify the trends.
The pattern is a combination of
- Right shoulder
- Head
- Left shoulder
Shoulders represent two high or low points, where the head shows the highest or lowest price. It would be best if you worked smartly while trading with these technical indicators.
Almost all traders have a misconception that spotting a Head and Shoulders pattern means the trend will reverse. Most importantly, you have to consider two things.
- Strength
- Duration of the trend
Moreover, the neckline is considered as the most significant component. The special factor acts as the sparkline for trading the pattern.
Relative Strength Index - An Ancient Indicator:
The short form of the Relative strength index is RSI. It is an ancient indicator that has been around since the 1970s. Also, RSI is widely known as an oscillator indicator.
Do you know what exactly this indicator shows?
It helps you to decide whether your selected financial instrument is a good deal or not. So, ultimately, you can find out if an instrument is overbought or underbought.
Expert says financial asset over 70% is reported to be overbought. On the other hand, anything lower than 30% is said to be underbought.
However, you have to apply a few techniques to spot out the best prediction. It works depending on a formula. Later, we will discuss broadly in a separate article.
Triangle Patterns - A Short Story To Tell:
The last pattern or indicator that we are going to describe here is the Triangle Pattern. It is a commonly used technical analysis tool that helps traders to show the bullish or bearish market.
There are three types of triangle patterns available,
- Symmetrical
- Ascending
- Descending
Using an ascending triangle pattern, traders enter into a long position on a break above the resistance. Traders do the exact opposite thing while they use a descending pattern.
Furthermore, the symmetrical pattern is named by its symmetric shape. You will find that the price action grows increasingly narrow. So, it can break out into an uptrend or a downtrend.
Free Checklist - How To Win The Market?
The man with a lamp. Warren Buffett is the man who inspires many young investors to grow their money. He believes that
Successful investing takes time, discipline, and patience.
It is hard to ignore because no matter how talented you are, some things take time to show its result. You can not overlook a tiny thing of a financial market to eat a small pie.
If you are still looking for a shortcut solution, it’s better to take off from this path. Making money is only possible if your selected indicators help you to spot the trend.
However, this is only applicable for trend traders. But applying strategy to predict the future asset price is indispensable to all types of traders.
Apart from gaining knowledge on the basics of trading, there are many keys that one should remember. All these points together will give you the pass to enter into the market as successful traders.
- Make a concrete plan
- Strongly keep a trading journal
- Never listen to others
- Be realistic with-profits
- Start with a small investment
Mentioned points are the major checklist to win the market. To get the 13 Market Leading binary options tips, please read this article.
Things To Bear In Mind
Do you think only trend strategy can bring money to your pocket?
Those who blindly believe in trends will fall in the trap. Because the trends chart also will keep fluctuation.
If you are planning to make all your investments in one day, there is no guarantee on the return on the next day, even if your research was absolutely right.
The reason for this is what you see now will not be the trend after 30 minutes. So the decisions and actions should not be swift but smart.
- Trend analysis will give a clear picture of the present trends
- Helps to predict the future movement based on past flow
- You can choose the length of the trade
- Control overbuying and overselling of underlying assets
- Control in the financial market
Final Words
Apart from other strategies, a trend strategy is the most common form of strategy that traders use. It is the best strategy that is very easy to understand and easy to put into practice.
However, it does require analyzing the charts using various indicators. Instead of going through report and documents, a trend chart can share high-level information within a couple of minutes.
So, start your first trade with our top-rated trading broker Binary.com using trend strategy.


