Using Moving Average to Form a Successful Binomo Strategy
Linear indicators have a simple interface, which is why they are recommended for beginners who are starting to learn trading.
In this article we will consider a simple strategy which is based on two lines of the Moving Average.
The system is best suited for the Binomo trading platform, as it is aimed at short-term trading.
The strategy is universal; however, the best asset for second charts is the Binomo cryptocurrency index – CRYPTO IDX.
It was specially designed for trading on small chart intervals.
High Capital Risk Is Involved In Financial Trading
Overview of the indicators
Moving Averages are the most popular indicators among traders. However, there is another popular indicator available which is Alligator. To know about Alligator indicators, you can read this article.
There is a wide range of different types of MA, including about 10 quite common ones.
The Binomo platform offers 11 types of Moving Average. The most popular types are the Simple (SMA) and Exponential (EMA) Moving Averages.
The basis of the formula for all the tools is the same – it is to find the arithmetic average of the average value of the price over a certain period.
SMA uses the classic formula without any extra functions.
The curve shows the average price value for a certain number of price bars.
That parameter is indicated on the chart. The standard value for Binomo is 50.
An advantage of SMA is its inertia.
You can use it to easily determine the direction of absolute trends on the chart without taking into account minor price fluctuations.
The exponential curve differs from the simple MA in its greater dynamism.
The averaging formula is constructed in such a way that the price bars at the beginning of the period have a greater impact on the position of the curve than the candles at the end.
And the “weight” of the first and the last bar in the SMA period are equivalent.
Preparing the terminal for trading
Strategies based on the Moving Average are extremely simple.
Therefore, setting up the Binomo platform takes no more than a minute.
Step-by-Step Instructions:
- Open the CRYPTO IDX chart
Activate the candlestick chart mode with a time frame of 5 seconds;
Set the amount of investment to within no more than 5% of the balance and the minimum expiration period
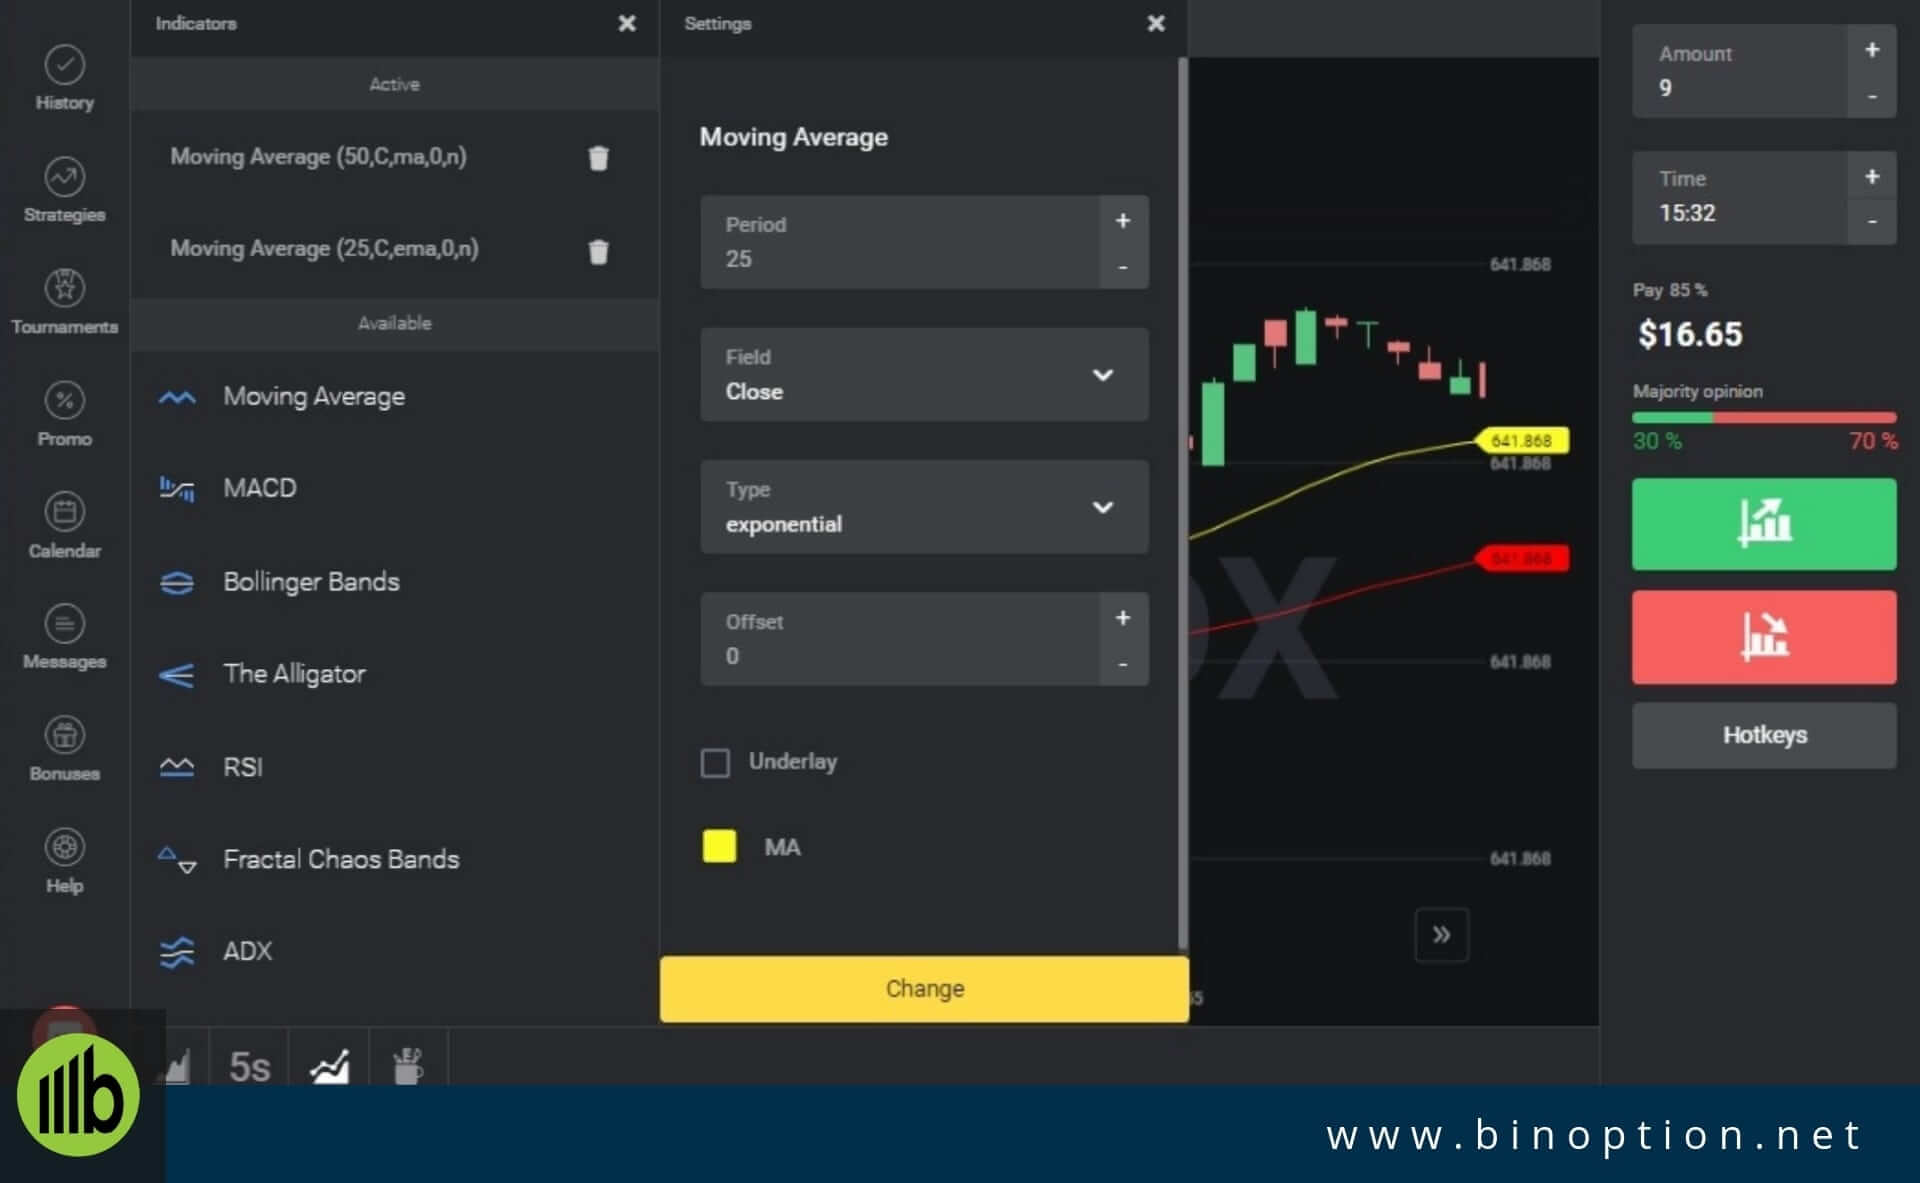
- Add two Moving Average curves
The first Moving Average should have the default settings: period 50, type – Simple, color – red. The parameters of the second line must be set manually: period – 25, type – exponential, color – yellow.
Strategy Signals
The advantage of strategies based on Moving Averages is their simplicity. This system uses red and yellow lines.
To make it simpler, traders are advised to consider the yellow EMA as a conventional trend direction indicator. The intersection point and the final order of line construction are what should be monitored.
Attention should also be paid to which of the lines on the chart is closer to the price.

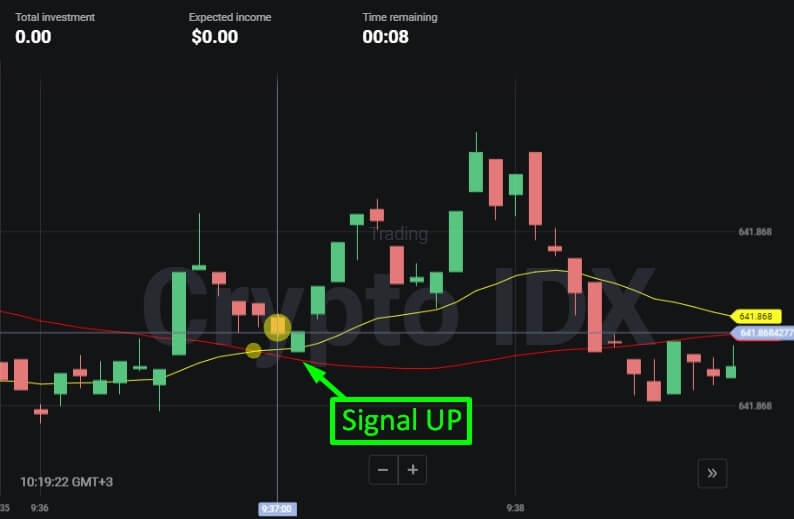
The signal for an increase is formed against the background of a downtrend reversal, when a rapid price increase leads to the price overtaking the Moving Average beam, and as a result, it is in a position below the price.
Enter the market after the intersection of the EMA and SMA, when the yellow line is above the red one.

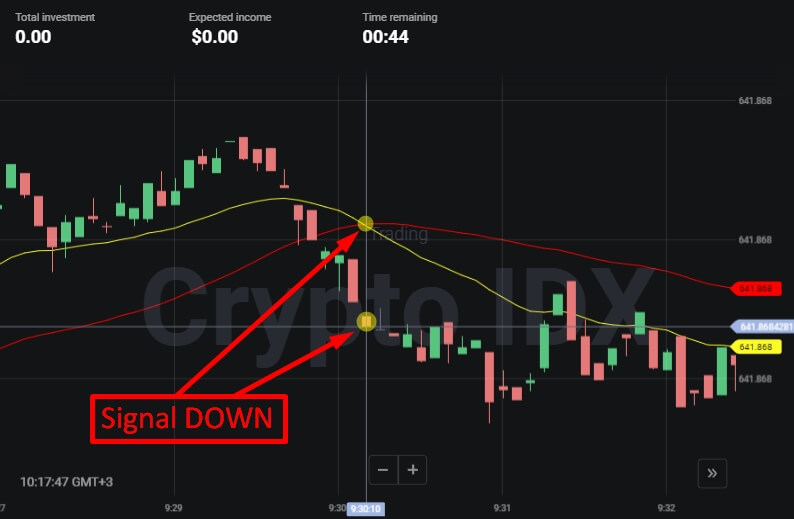
The signal for a decrease is formed during an uptrend reversal.
The downward price movement should break through the Moving Average beam and end up under it.
A “Down” contract is purchased at the moment of intersection of the curves.
The EMA with the yellow fill should be in a position below the red SMA.
The signals are clearly illustrated in the pictures above.
Conclusion
The rules of the strategy are so simple that any beginner who knows how to use a trading terminal can handle it.
However, if you blindly monitor the signals without evaluating the totality of the situation on the chart, then their accuracy will be relatively low. Therefore, in conclusion, we must consider a key issue that will make trading on the system more efficient.
The market should be entered only against the background of a trend reversal.
This type of situation is relatively rare if you consider the scale of the candlestick chart.
However, on the 5-second interval, waiting for the signal you need won’t require much time.
Traders with a certain level of practical experience can assess the strength of trends just by glancing at them. Beginners should be advised to assess the amount of candlestick deviation from the beam of Moving Averages.
The greater the distance, the better. If the candles are close to the SMA and EMA pair, then trading on that signal is not recommended.
The distance between the Moving Average lines is also important. The smaller that figure is, the worse. When the market moves in a horizontal plane, the two lines practically merge into one.
On the other, winning trading result always depends on a successful trading method and a proper trading strategy.


